Title
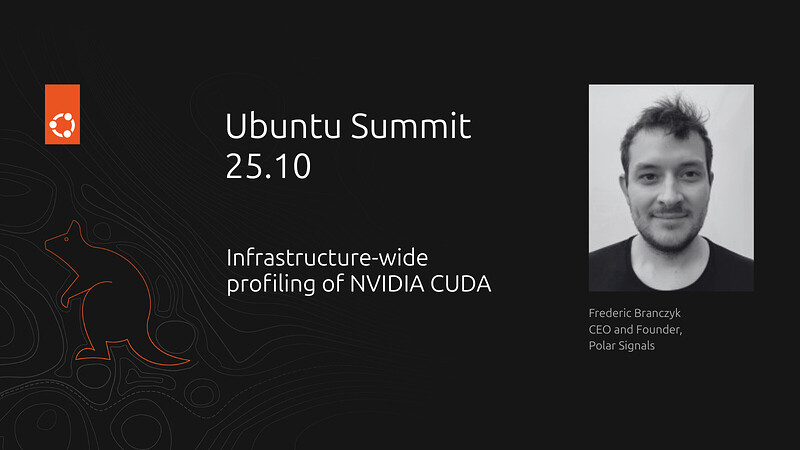
Infrastructure-Wide Profiling of Nvidia CUDA
Speaker(s)
Frederic Branczyk
Date and time
2025-10-24T09:00:00Z
Session type
![]() Talk (25 minutes)
Talk (25 minutes)
Abstract
Profiling is a well-known and understood tool in the developer’s toolbox for CPU- and memory-bound workloads; however, tooling for GPU workloads is far and in between. Nvidia NSight is a great tool for local development, and records some aspects of GPU workloads at high resolution, but it is quirky to use in production, and practically impossible to use in an always-on fashion. The difficulty with profiling, much like with any other observability, is that the most interesting things occur when we’re not actively observing.
Introducing Nvidia CUDA kernel execution profiling as part of the Parca open-source project. With this feature, all CUDA kernel executions can be traced, their total execution time noted, and even record the function call-stack that resulted in calling the Kernel. With this data in hand, optimizing and observing GPU workloads is finally as easy as any other workload.
In this talk, Frederic will explain how the CUDA execution profiling feature works, how it can be used to optimize CUDA workloads, and show it all in action!
Join this talk to take your GPU observability to the next level.
Speaker(s) bio
Frederic is the founder of Polar Signals. Before, he was a senior principal engineer and the main architect for all things Observability at Red Hat, which he joined through the CoreOS acquisition. Frederic is a Prometheus and Thanos maintainer and tenured as the tech lead for for SIG instrumentation in Kubernetes for 4 years. In his previous life, he was a security researcher. When not working on software Frederic enjoys obsessing over brewing a perfect cup of coffee.
![]() Questions about this session? Please reply to this topic, top questions may be featured during the live event!
Questions about this session? Please reply to this topic, top questions may be featured during the live event!
