This example implementation provides a starting point for a monitoring stack that can be used to gather metrics with Telegraf and Prometheus and access them through Grafana.
This reference implementation is provided for demonstration purposes only. It does not cover all aspects that you should consider for a production-level solution (for example, high availability). It cannot be used with the Anbox Cloud Appliance.
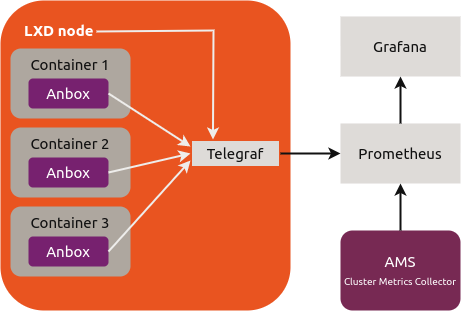
In this setup, every LXD cluster node runs a Telegraf instance that gathers the machine metrics. All Anbox containers that exist on the node also report their metrics to the Telegraf instance.
Prometheus gathers the metrics provided by the different sources (the Telegraf instances, AMS, Anbox Stream Gateway and NATS) and stores them in its time series database. You can then access, query and visualise the full metrics data through Grafana.
Deploy the solution
The monitoring stack is provided as an overlay file that you use when deploying Anbox Cloud.
The overlay file adds a machine to the deployment (with ID 2 for the anbox-cloud-core bundle or ID 3 for the anbox-cloud bundle), which is used to run Grafana, Prometheus and HAProxy (as a reverse proxy that secures access to the internal endpoints of the other services). In addition, the overlay installs and configures Telegraf for both AMS and the LXD nodes, and it creates the required relations.
The minimum requirements for the additional machine are as follows:
| Architecture | CPU cores | RAM | Disk | GPUs | Components |
|---|---|---|---|---|---|
| amd64 | 4 | 4 GB | 100 GB SSD | no | Grafana, Prometheus |
Complete the following steps to deploy Anbox Cloud with the reference monitoring stack:
-
Create a
monitoring.yamlfile using the following example files, depending on which Juju bundle you want to deploy:Note:For a production-level solution, replace the automatically generated self-signed SSL credentials with proper ones.
-
Deploy Anbox Cloud with the overlay file.
-
For the
anbox-cloud-corebundle:juju deploy anbox-cloud-core --overlay monitoring.yaml -
For the
anbox-cloudbundle:juju deploy anbox-cloud --overlay monitoring.yaml
Note:You can use the same command if you already deployed Anbox Cloud. In this case, Juju checks the existing deployment and only deploys new components.
-
-
Wait until all added units are in
activestate.
Access Grafana
To access the metrics in Grafana, go to https://<IP_address>/grafana in your browser.
Replace <IP_address> with the IP address of the machine on which you deployed the grafana-proxy application. If you don’t know the address, run juju status to display the information for all machines.
You must enter your user name and password to log in. The user name is admin. You can determine the password by running the following command:
juju run --wait=5m grafana/0 get-admin-password
If you have deployed more than one Grafana unit, you might need to replace the 0 in grafana/0 with the suitable unit ID. Check juju status if you are in doubt.
The response should look similar to this:
unit-grafana-0:
  id: 29f07367-556b-41d0-8318-b9fa13a78b63
  results:
    password: jd673zyYWkR7kyPW
  status: completed
  timing:
    completed: 2018-06-29 13:29:38 +0000 UTC
    enqueued: 2018-06-29 13:29:36 +0000 UTC
    started: 2018-06-29 13:29:38 +0000 UTC
  unit: grafana/0
In this example output, the password is jd673zyYWkR7kyPW.