Metadata
| Key | Value |
|---|---|
| Summary | Multipass Metrics with Prometheus Node Exporter. |
| Categories | metrics |
| Difficulty | 1 |
| Author | Michael Thamm |
The original tutorial can be found on the CharmHub Discourse: Enhancing Multipass Metrics with Prometheus Node Exporter - prometheus - Charmhub
Contents:
- Introduction
- Deploy and Configure a Multipass VM
- Browse Prometheus Graphs
- Grafana Agent Forwarding to Prometheus
- Next steps
- Host Environment Cleanup
Introduction
When managing a Multipass virtual machine (VM), the multipass info command and the Multipass GUI client, instances tab provides useful metrics. However, from outside of the VM there is much more we can extract that is not exposed by Multipass itself.
The focus of this tutorial is to use the Prometheus snap on your host to monitor metrics exposed by Prometheus node-exporter running as a service within a Multipass VM.

This tutorial assumes you have the following snaps installed on your host: multipass, prometheus, and jq. This can be achieved with:
sudo snap install multipass prometheus jq
Let’s go and monitor some Multipass VMs!
Deploy and Configure a Multipass VM
Create 2 VMs running Ubuntu 22.04 named multipass-vm-1 and multipass-vm-2 with:
multipass launch 22.04 --name multipass-vm-1
multipass launch 22.04 --name multipass-vm-2
Install the prometheus-node-exporter apt package inside the VMs:
multipass exec multipass-vm-1 -- sudo apt install -y prometheus-node-exporter
multipass exec multipass-vm-2 -- sudo apt install -y prometheus-node-exporter
The prometheus-node-exporter apt package runs the binary and exposes it on port 9100
Once the VMs are created, retrieve their IPv4 addresses:
multipass info multipass-vm-1 --format json | jq -r '.info["multipass-vm-1"].ipv4[0]'
multipass info multipass-vm-2 --format json | jq -r '.info["multipass-vm-2"].ipv4[0]'
Replace <VM1_IP> and <VM2_IP> in the YAML content below with the results from above
sudo tee /var/snap/prometheus/current/prometheus.yml > /dev/null <<EOF
global:
  scrape_interval: 15s # The default is every 1 minute.
  evaluation_interval: 15s # The default is every 1 minute.
scrape_configs:
  - job_name: prometheus
    static_configs:
    - targets: ['localhost:9090']
  - job_name: multipass-vm-1
    static_configs:
    - targets: ['<VM1_IP>:9100']
  - job_name: multipass-vm-2
    static_configs:
    - targets: ['<VM2_IP>:9100']
EOF
To reload the config file, restart the Prometheus snap:
sudo snap restart prometheus
Browse Prometheus Graphs
The following table provides two sample metric expressions with links that can be opened in a browser. The browser accesses the Prometheus service running on http://localhost:9090. Try them to see the results!
| Metric | Meaning |
|---|---|
rate(node_cpu_seconds_total{mode="system"}[1m]) |
The average amount of CPU time spent in system mode, per second, over the last minute (in seconds) |
rate(node_network_receive_bytes_total[1m]) |
The average network traffic received, per second, over the last minute (in bytes) |
Select the Graph tab in the web UI to see the results:

Now you have real-time metrics, scraped and evaluated, every 15 seconds by Prometheus in a nice web UI that leverages the node-exporter capabilities, have fun observing!
Grafana Agent Forwarding to Prometheus
The previous setup is fine, but we can improve our observability by introducing Grafana Agent to our architecture. Grafana Agent is a telemetry collector for sending metrics, logs, and trace data to:
- Prometheus ecosystem
- OpenTelemetry ecosystem
- Grafana ecosystem (Loki, Grafana, Tempo, Mimir, Pyroscope)
For the scope of the tutorial, we will send metrics to our Prometheus snap from before.
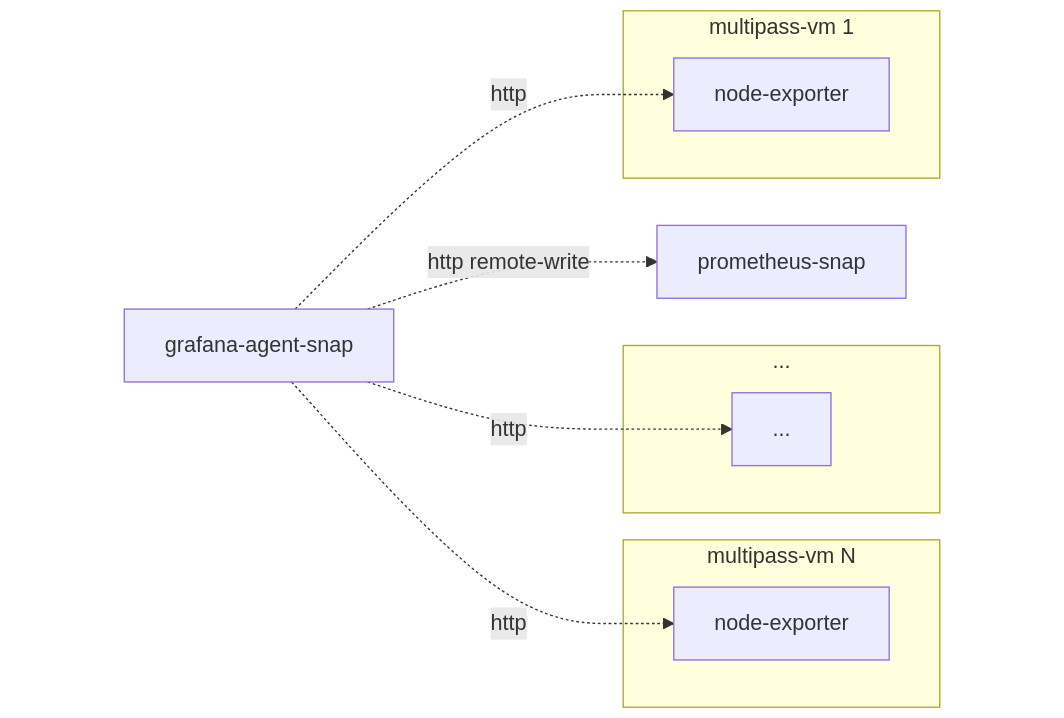
First, install the Grafana Agent snap with:
sudo snap install grafana-agent
Then, update the config file to scrape the metrics of the VMs and Grafana Agent itself. Remember to replace <VM1_IP> and <VM2_IP> in the YAML content:
sudo tee /var/snap/grafana-agent/current/etc/grafana-agent.yaml > /dev/null <<EOF
metrics:
  global:
    scrape_interval: 15s
  configs:
    - name: agent
      scrape_configs:
        - job_name: grafana-agent
          static_configs:
            - targets: ['localhost:12345']
        - job_name: multipass-vm-1
          static_configs:
            - targets: ['<VM1_IP>:9100']
        - job_name: multipass-vm-2
          static_configs:
            - targets: ['<VM2_IP>:9100']
      remote_write:
        - url: http://localhost:9090/api/v1/write
EOF
Since we are moving the scraping responsibility to Grafana Agent, the Prometheus config file can be updated by removing the scrape_configs for the Multipass VMs:
sudo tee /var/snap/prometheus/current/prometheus.yml > /dev/null <<EOF
global:
  scrape_interval: 15s # The default is every 1 minute.
  evaluation_interval: 15s # The default is every 1 minute.
scrape_configs:
  - job_name: prometheus
    static_configs:
    - targets: ['localhost:9090']
EOF
To enable remote-write for Prometheus, we need to modify the daemon_arguments file with:
sudo sed -i 's/^ARGS=""/ARGS="--web.enable-remote-write-receiver"/' /var/snap/prometheus/current/daemon_arguments
To apply the configuration changes, restart the Prometheus snap:
sudo snap restart prometheus
Warning: The file daemon_arguments file states:
Due to snap confinement the following options should not be set
For this tutorial, the warnings can be ignored since the /api/v1/write endpoint is on the same host port 9090 and we are not exposed to the outside world. In a production scenario TLS, authentication, and access control should be considered.
With the config files set, we can start grafana-agent:
sudo snap start grafana-agent
Finally, check that Grafana Agent is correctly writing to Prometheus with this link:
rate(node_cpu_seconds_total{mode="system"}[1m])
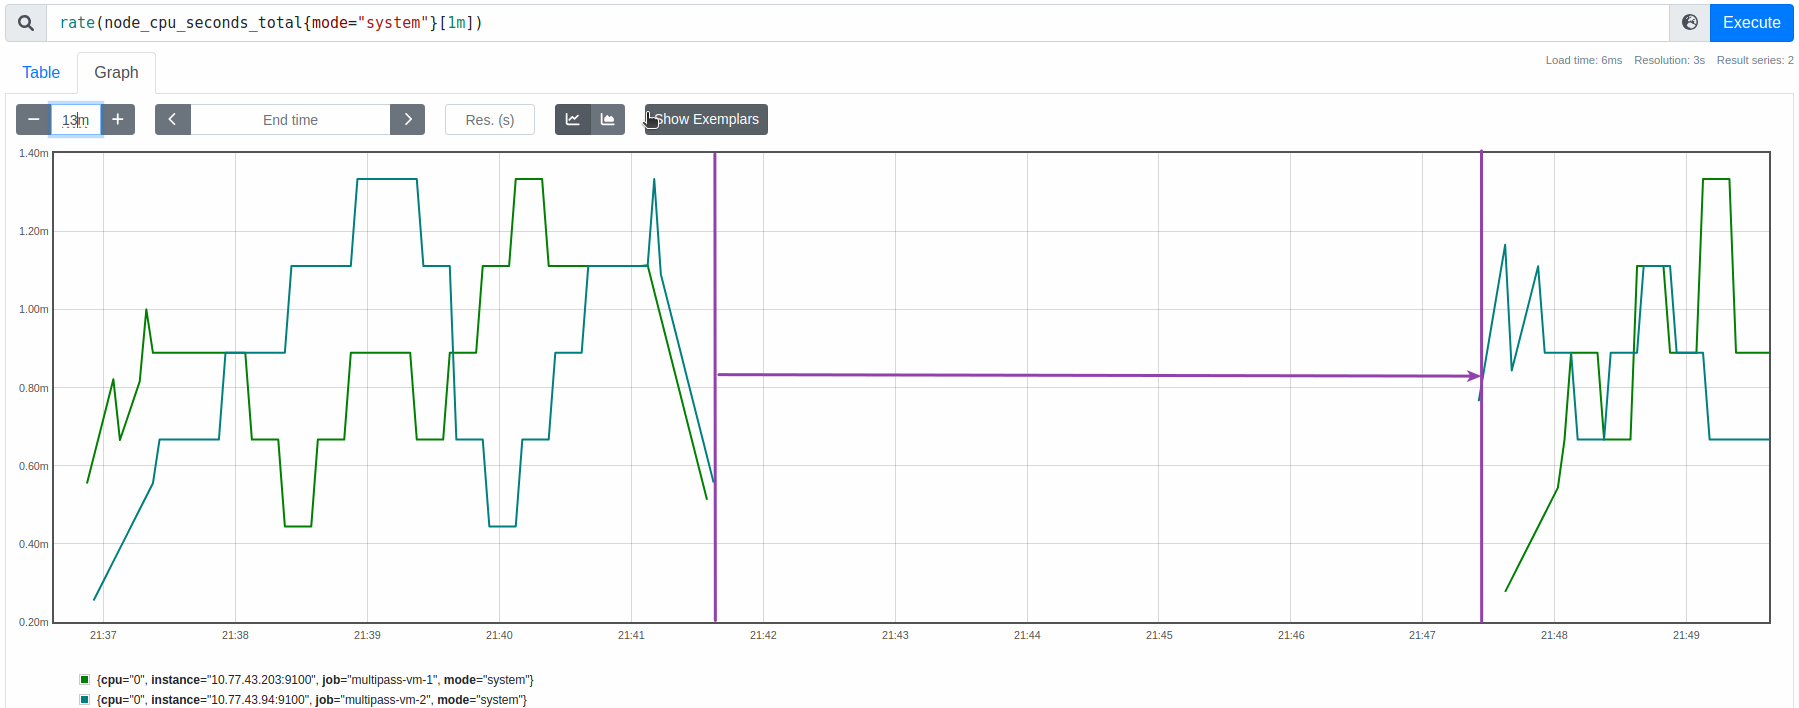
As you can see, there was a section where metrics were not being received by Prometheus. This section is highlighted in purple and is the time it took to switch over from Prometheus to Grafana Agent for scraping.
Note: We can check which jobs are being scraped with http://localhost:9090/api/v1/label/job/values
Next steps
- Try out some more host and hardware expressions.
- Replace the Prometheus and Grafana Agent snaps with a COS-Lite bundle deployment to observe the true power of observability.
Host Environment Cleanup
To return your host environment back to the original state, remove the Multipass VMs:
multipass stop multipass-vm-1 & multipass delete -p multipass-vm-1
multipass stop multipass-vm-2 & multipass delete -p multipass-vm-2
Remove the snaps installed for this tutorial,
Warning: Run multipass list before continuing to ensure that you do not have any important VMs running in Multipass before removing the snap!
sudo snap remove --purge multipass prometheus grafana-agent jq